Bob Financial Insights
See the full financial picture together
From people spend to profitability, give finance and business leaders instant access to the metrics that drive success.
Trusted by leading companies to connect people and financial strategy
Financial intelligence at your fingertips
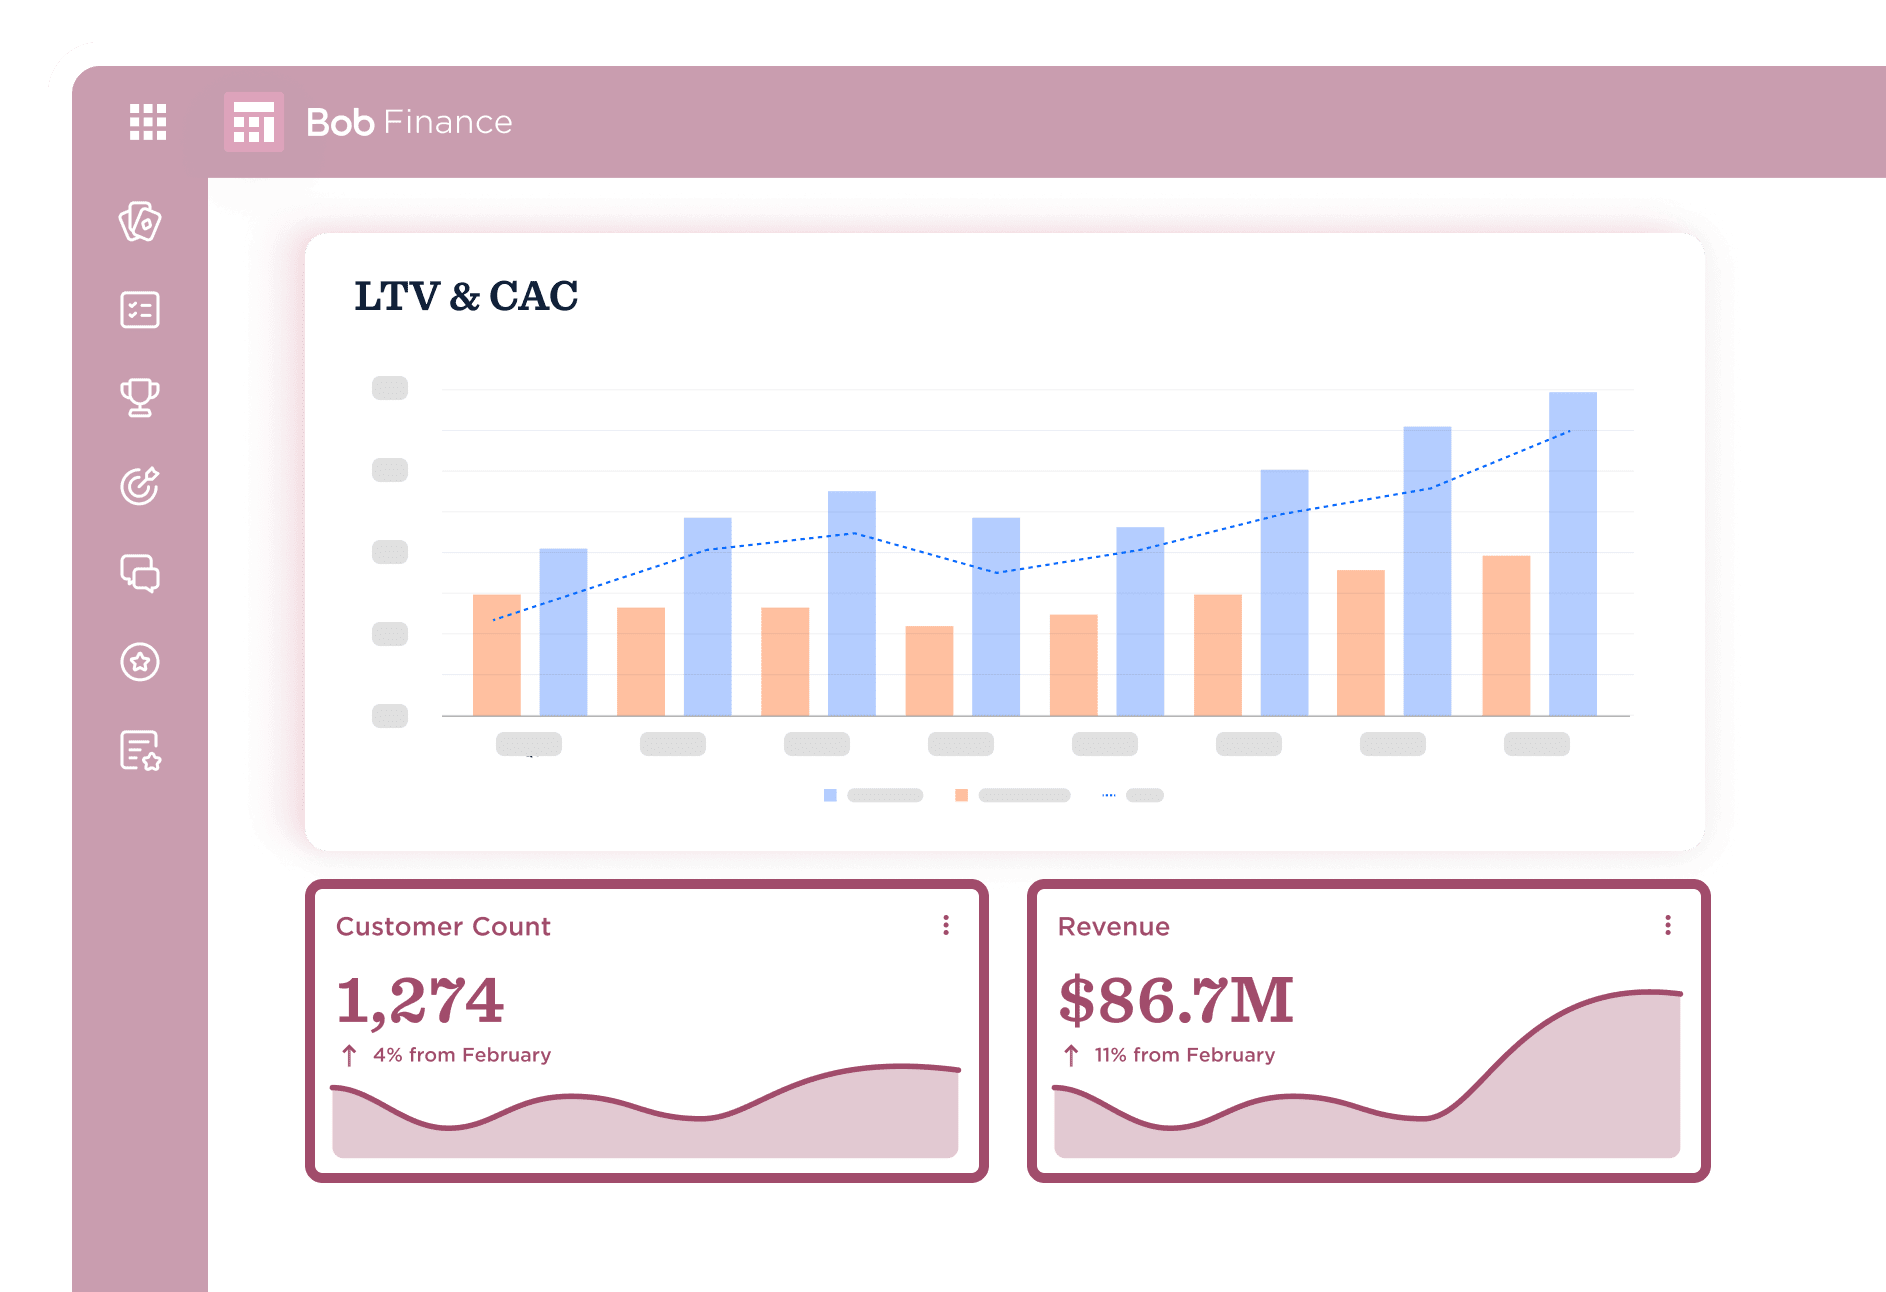
Analysis canvas
The power of a dashboard, the flexibility of a document
The Analysis canvas is the connective tissue across your business—easily create, monitor, and share performance to get the right data, to the right people, at the right time.

Metrics catalog
Run powerful analysis, on demand
Put performance in focus with automated insights from Bob’s Metrics catalog.

Single source of truth
Connect every system automatically
Unify people, financial, and operational data so every decision starts from the same source of truth.

Metric builder
Unlock your data with custom metrics
No technical code. No black-box formulas. Just a simple, visual experience that lets you build the metrics you rely on most—at lightning speed.

Collaboration
Align your teams on the metrics that drive success
Powerful sharing and collaboration tools ensure everyone is always on the same page and moving towards the same goals.

Do more with AI

Automated insights
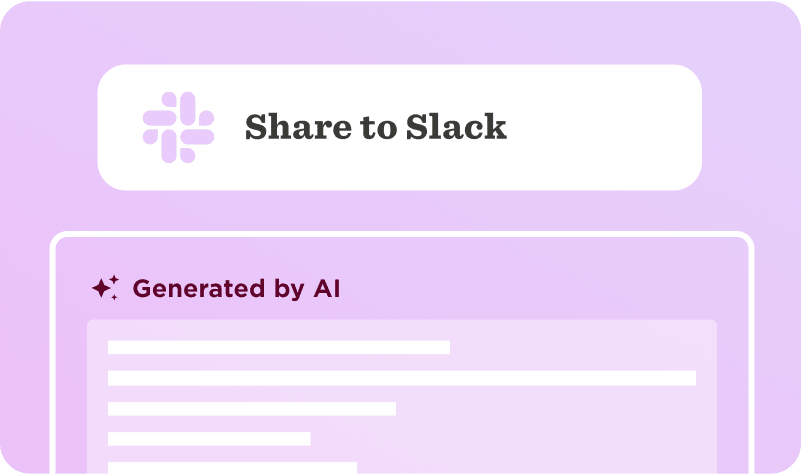
Slack integration
Why Bob Financial Insights?

Streamline data prep with automated integrations

Deliver timely answers to build business trust

Prepare board reports and KPIs in minutes
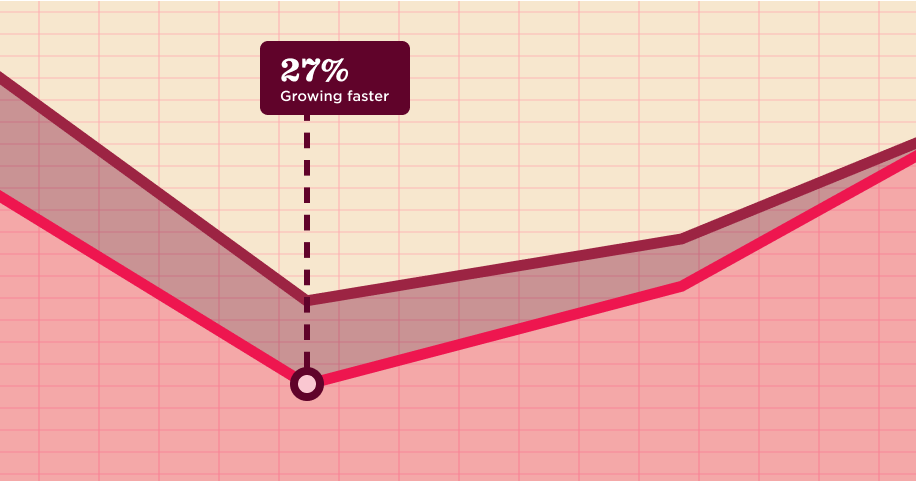
Don’t just take our word for it
Discover how our reporting and dashboard tools help companies like yours build a best-in-class FP&A function.
We raised our Series A and we used Bob Finance to run all of our financial projections for current and potential investors.

Mike Nucci, Director of Operations, MaestroQA
Resources to go from data to decision, faster


Frequently asked questions
What makes Bob Financial Insights different from other analytics tools?
Bob Financial Insights unifies financial, operational, and people data in one platform, so every decision is based on the same live numbers. Instead of juggling spreadsheets or disconnected systems, Finance, HR, and leadership can work together in real time. This unique connection between people and financial strategy helps companies move faster, stay aligned, and make decisions with full context.
Can Bob Financial Insights replace my existing reporting tools?
Yes, in many cases it can. With 150+ automated metrics, 35+ reporting templates, and a no-code Custom metric builder, Bob Financial Insights delivers everything from high-level dashboards to detailed variance analysis. You can share live, interactive reports or export them for board decks, investor updates, and departmental reviews. The result is accurate, consistent reporting without the manual effort.
Does Bob Financial Insights work for companies with multiple entities or regions?
Absolutely. Bob Financial Insights automates multi-entity consolidations so you can view financial and workforce data at both the consolidated and individual entity level. Real-time syncing from all your source systems ensures consistent, accurate numbers across subsidiaries, regions, and teams. This makes it easy to compare performance, spot trends, and make strategic decisions at any scale.
How long does it take to get Bob Financial Insights up and running?
Most companies are up and running in weeks, not months. With 30+ pre-built integrations for ERP, CRM, billing, HR, and data warehouses, your systems connect quickly without heavy IT involvement. Automated data mapping and out-of-the-box metrics mean you start seeing insights as soon as your data is synced.
How secure is our data in Bob Financial Insights?
Security is built into every layer of Bob Financial Insights. Data is encrypted in transit and at rest, with strict role-based permissions to ensure only the right people have access. As part of the HiBob platform, it meets rigorous compliance standards and undergoes continuous monitoring to protect your financial and workforce information.