
As an HR leader, you know that people-first strategies drive engagement, retention, and overall wellbeing. However, to secure leadership buy-in and resources, you must show how great employee experiences translate into measurable business impact.
For example, reducing turnover by just a few percentage points can save a company hundreds of thousands of dollars per year. In this workbook, you’ll learn a simple equation to calculate these savings with simple math. You’ll be able to show how HR efforts, like improving retention, directly impact business success.
These aren’t just HR wins; they’re business wins. This workbook will walk you through how to define and communicate the ROI of your HR initiatives through explanations, examples, and hands-on activities.
Ready to add ROI to your HR programs?
This workbook will help you:
- Identify key HR metrics that drive real business impact
- Calculate and track these metrics effectively
- Use data storytelling to present a compelling business case to leadership
How to get the most out of this workbook
Use this workbook as your hands-on guide to understanding and leveraging HR metrics for business impact. Whether you use it alongside the webinar or as a standalone tool, you’ll find exercises designed to help you track, analyze, and communicate the ROI of HR initiatives.
- Complete the exercises as you work through your HR data or at your own pace
- Use it digitally or print it out to build out your strategy and ROI points
- Refer back to it as you refine your HR strategy and present insights to leadership
Finding impactful HR metrics for your business
Determining which HR metrics to prioritize begins with understanding your organization’s unique challenges and goals. The right HR data is needed to connect your people strategies to business success.
Start by considering your organization’s biggest challenges and goals. Retention metrics may be a priority for a small business struggling with high turnover. Hiring efficiency and productivity metrics might take center stage if rapid growth is the focus.
A good starting point is asking yourself: What are our top business objectives this year, and how can HR contribute?
For example, if your company is expanding into new markets, metrics like time-to-fill for key roles or training ROI for upskilling employees may be critical. By aligning HR data with your company’s annual priorities, you can demonstrate how your programs contribute to achieving broader business goals.
Partnering with business leaders to identify the most pressing HR challenges is also important. Their input will help you focus on metrics that drive real business impact.
<<Download the workbook in document format to start your alignment strategy.>>
Activity: Asking the right questions to find the right metrics
Step one: Determine which metrics matter most for your organization by answering the questions below.
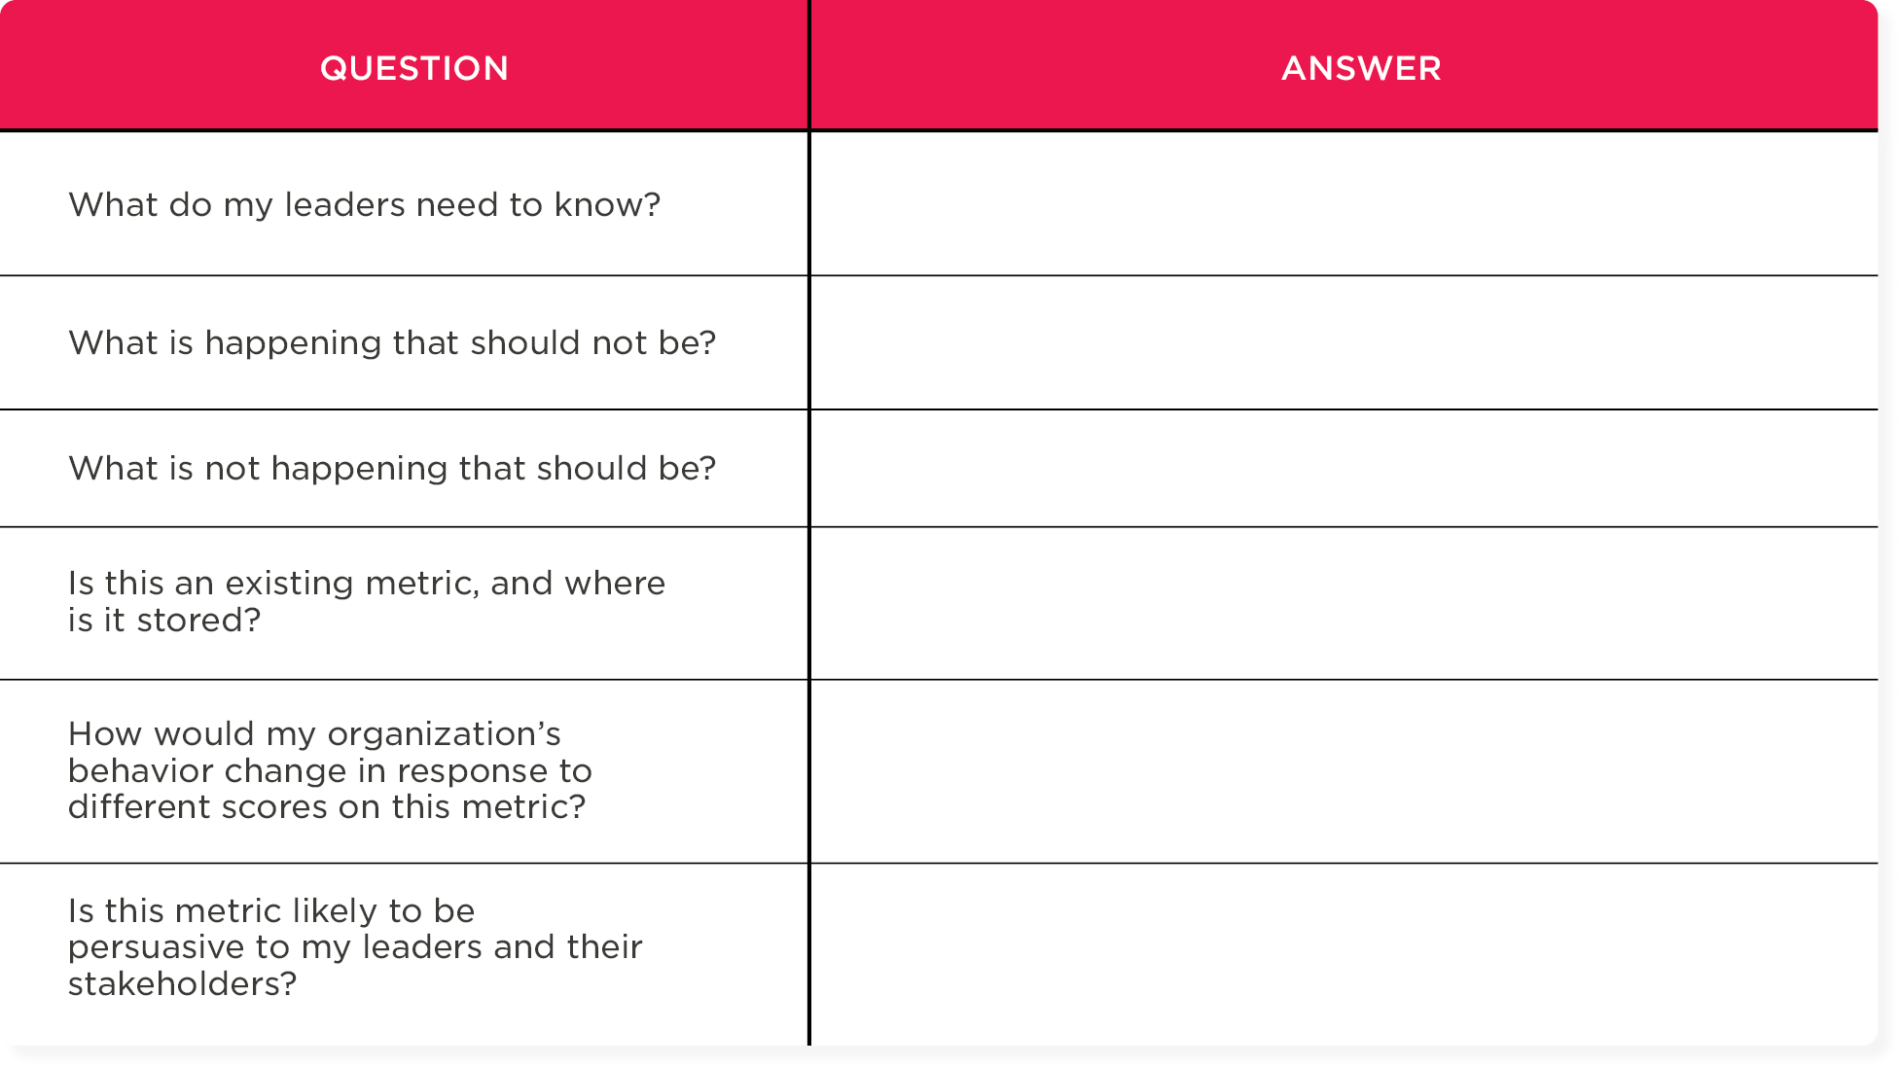
Once you’ve answered these questions, the next step is to tie them directly to business performance so HR’s impact is crystal clear.
Tying HR metrics to business performance
Instead of debating the importance of wellbeing, engagement, and retention, recognize that these initiatives are already central to your HR strategy. The work you’re doing is essential, and when you tie it to HR metrics, you amplify its impact.
HR metrics are the proof points that validate your impact. Here are some of the most powerful HR metrics to track:
- Hiring metrics: Measures how quickly new hires are brought on board and integrated into their roles. Shorter hiring times reveal hiring effectiveness, improve efficiency, and accelerate business growth.
- Productivity metrics: Measures job performance through revenue per employee, project completion speed, customer satisfaction scores, product quality, and other output-based indicators. These metrics quantify employees’ contributions to business success.
- Engagement score: Typically derived from employee surveys, this metric assesses employee motivation, commitment, and connection to the organization. Higher engagement often signals increased productivity, improved retention, and stronger advocacy for the company.
- Counterproductive behaviors: Tracks patterns of absenteeism, workplace incidents, or performance errors. Spikes in these areas can indicate burnout, job dissatisfaction, or workplace stress, helping HR address concerns before they affect operations.
- Rewards: Measures how employees are recognized and awarded for their contributions, including promotion frequency and salary adjustments. Ensuring that recognition aligns with performance helps retain top talent and manage workforce costs.
- Turnover and retention rate: Calculates the percentage of employees who leave or stay within a given timeframe. These insights help HR assess leadership effectiveness, workplace satisfaction, and the financial implications of losing skilled employees.
These metrics serve as clear, data-backed indicators of HR’s value. The next step is to identify which ones matter most for your business.
<<Download the workbook in document format to start your alignment strategy.>>
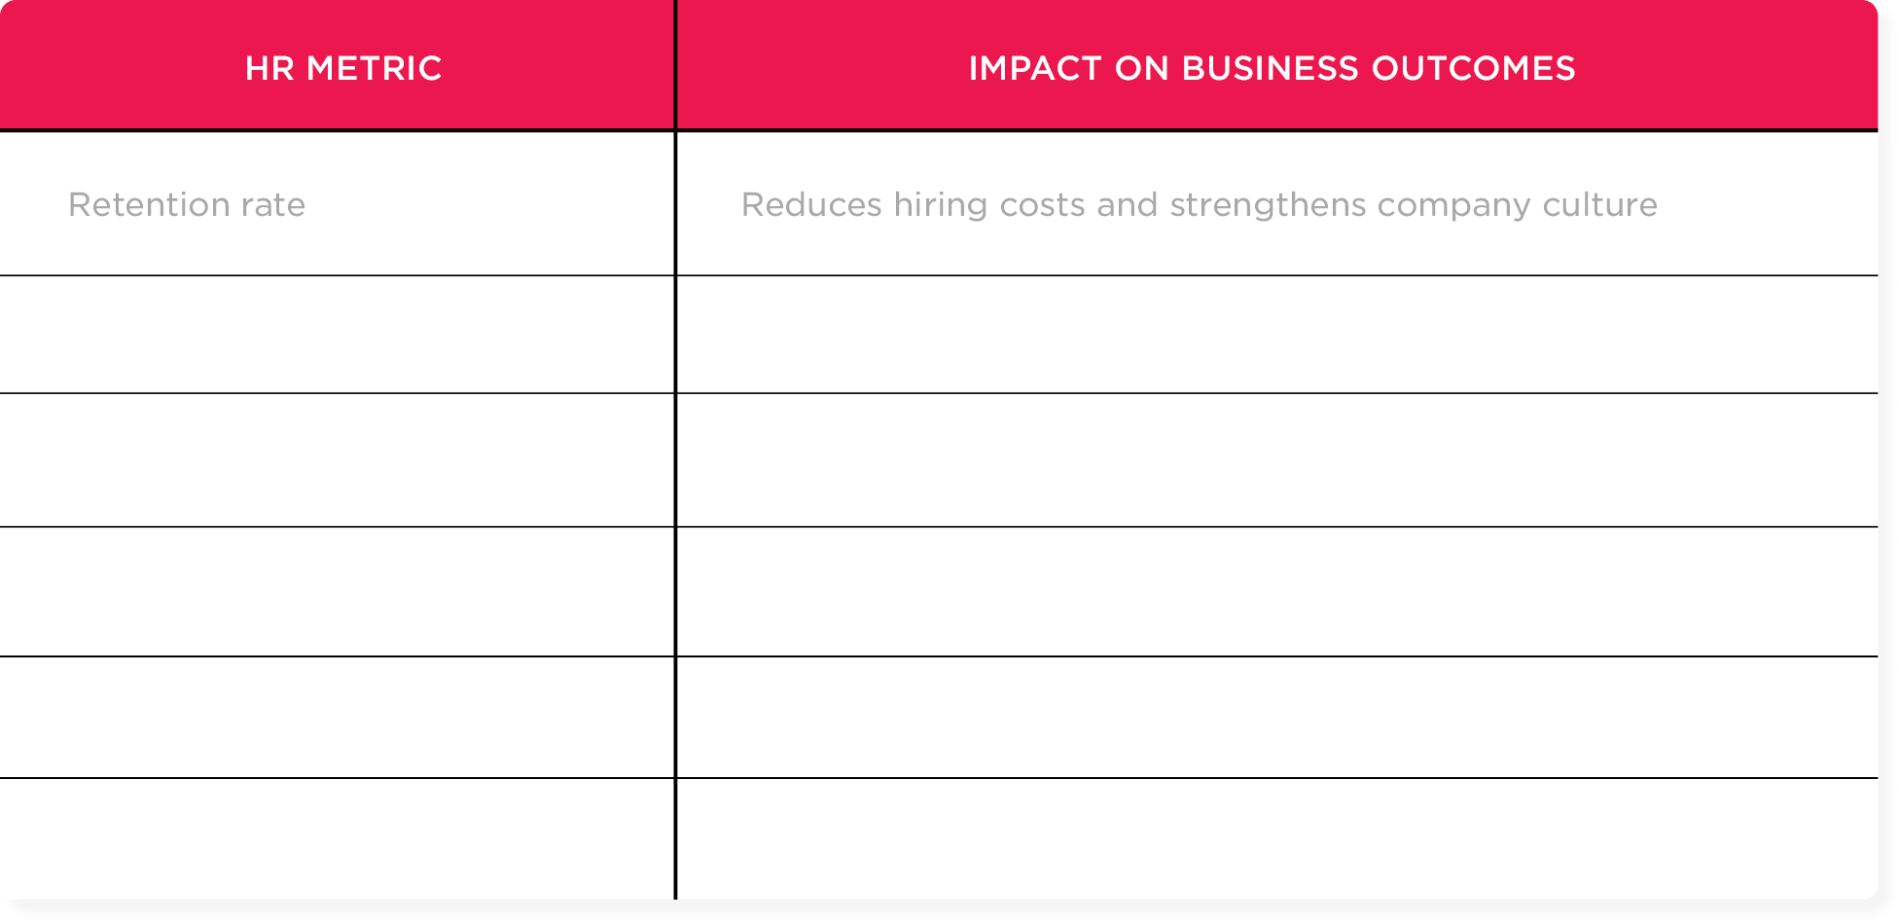
Activity: Aligning metrics with business goals and stakeholder expectations
Step one: Choose one or more of the HR metrics above that you can use in your team and list their impact on business outcomes—how they save money, increase efficiency, or drive revenue.
HR leaders know that engaged employees perform better, but for leadership outside of HR, the numbers must tell a compelling business story.
Here’s how key HR metrics translate into measurable business value:
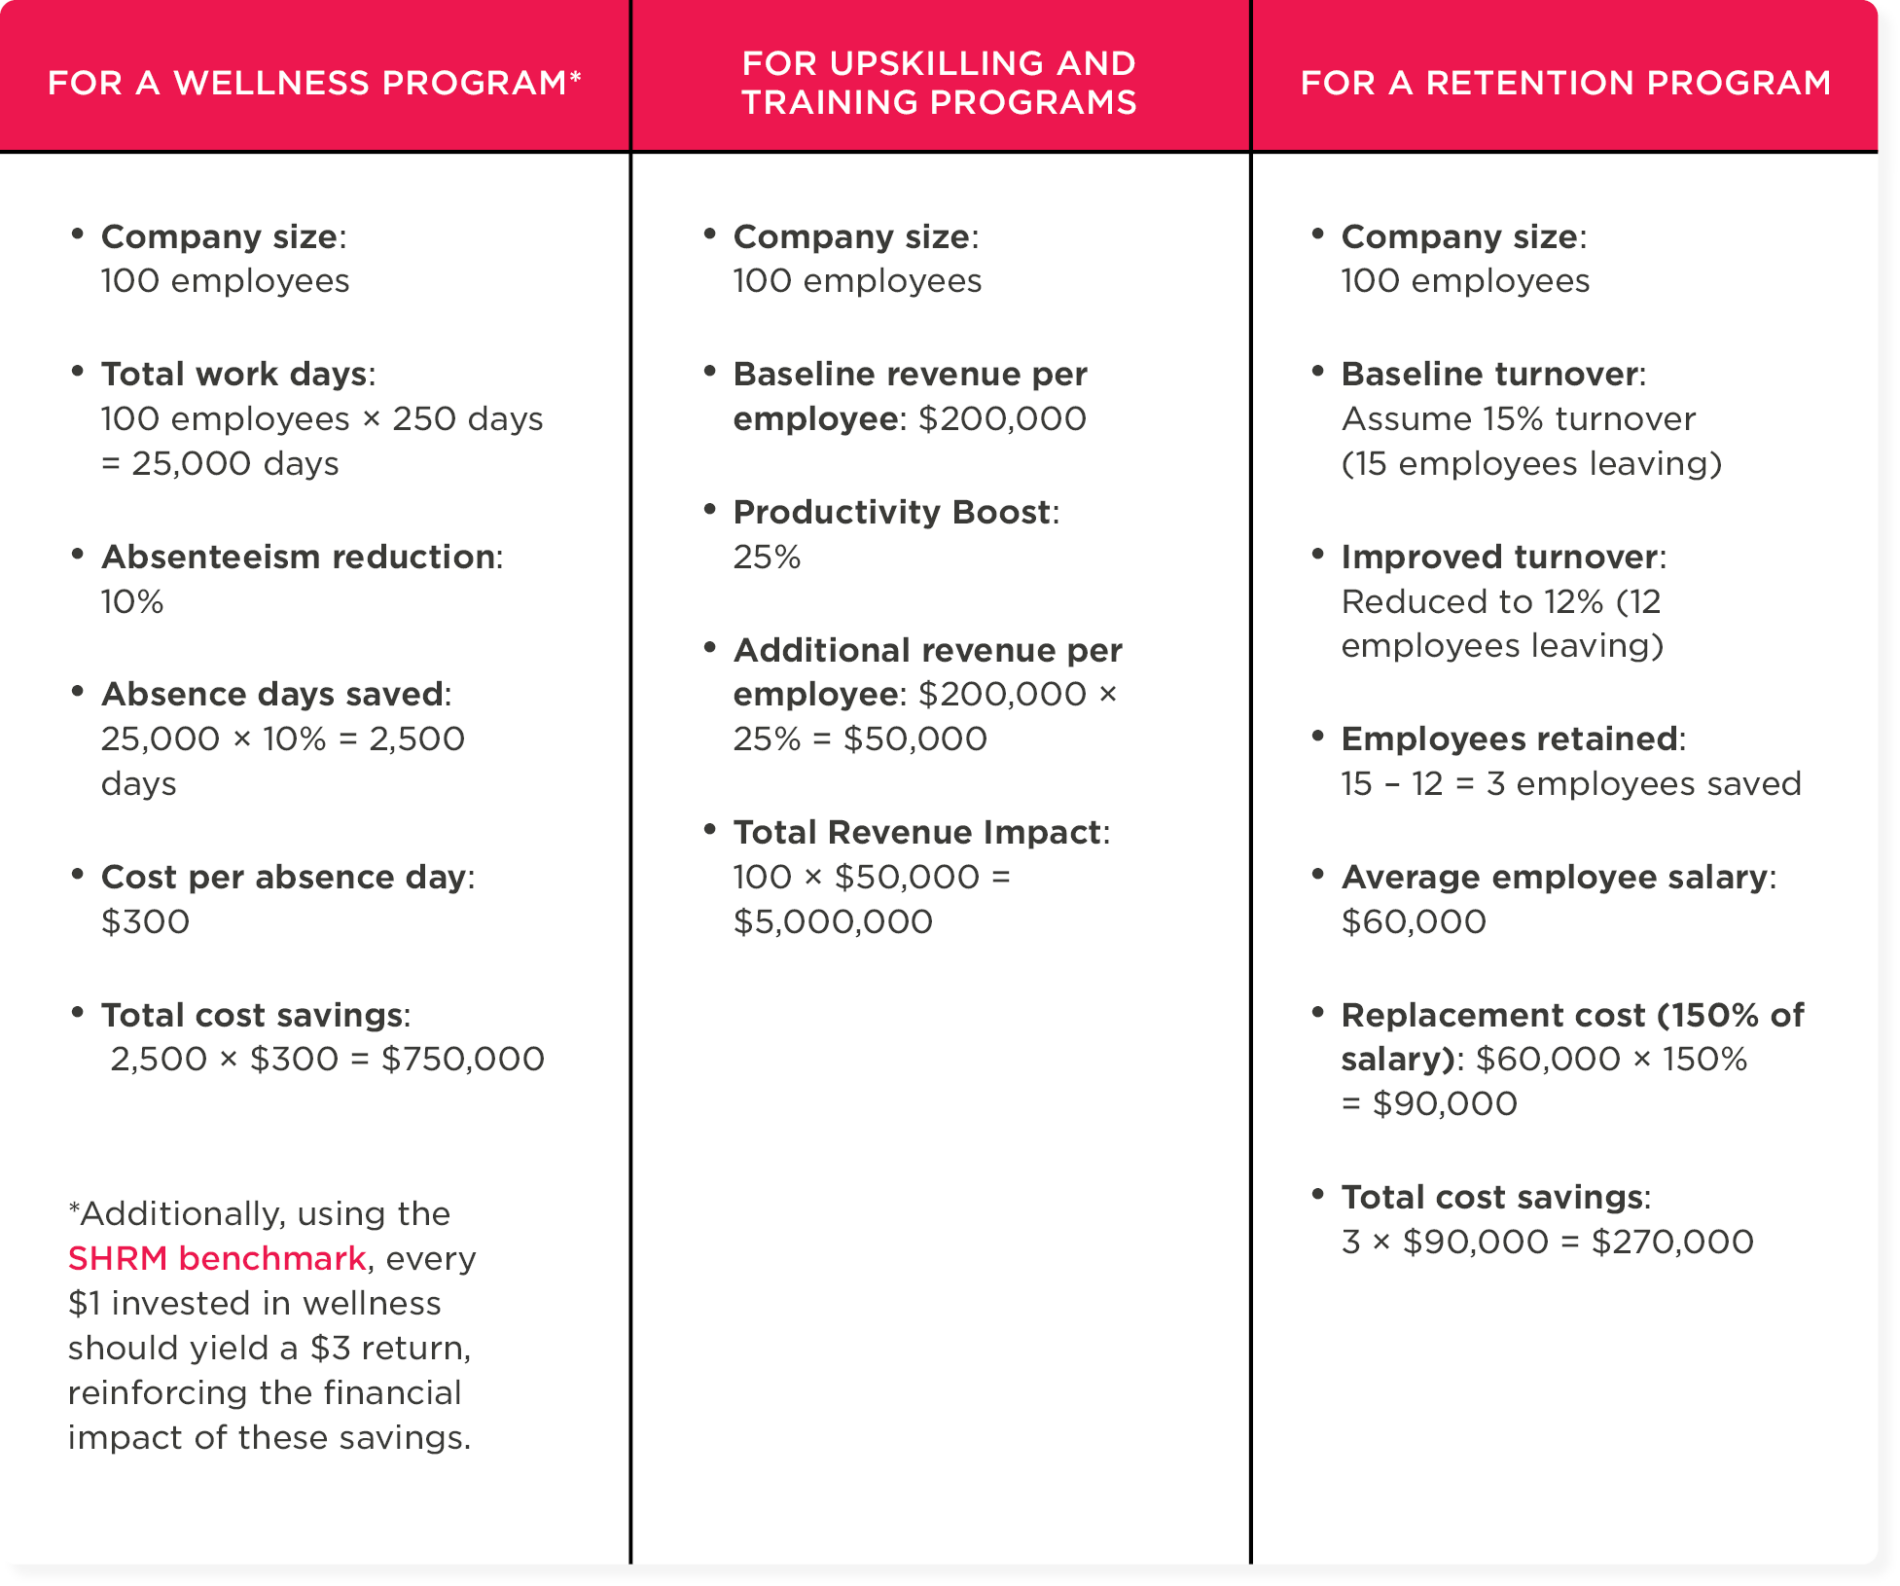
- Wellness programs lower absenteeism and reduce healthcare costs
- A SHRM study found that every $1 invested in employee wellness yields a $3 ROI due to fewer absences and lower healthcare expenses.
- Turnover and retention programs lower hiring costs and boost productivity
- The cost of replacing an employee due to recruiting, onboarding, training, and lost productivity can range from 90 percent to 200 percent of their salary. Even a tiny reduction in turnover leads to significant cost savings.
- Engagement programs lead to better performance, more productivity, and higher profitability
- Gallup research shows that highly engaged employees are 23 percent more profitable, and engaged sales teams are 18 percent more productive.
By framing HR metrics in business language—cost savings, revenue growth, and operational efficiency—HR professionals can shift perceptions, gain leadership buy-in, and reinforce HR’s strategic value.
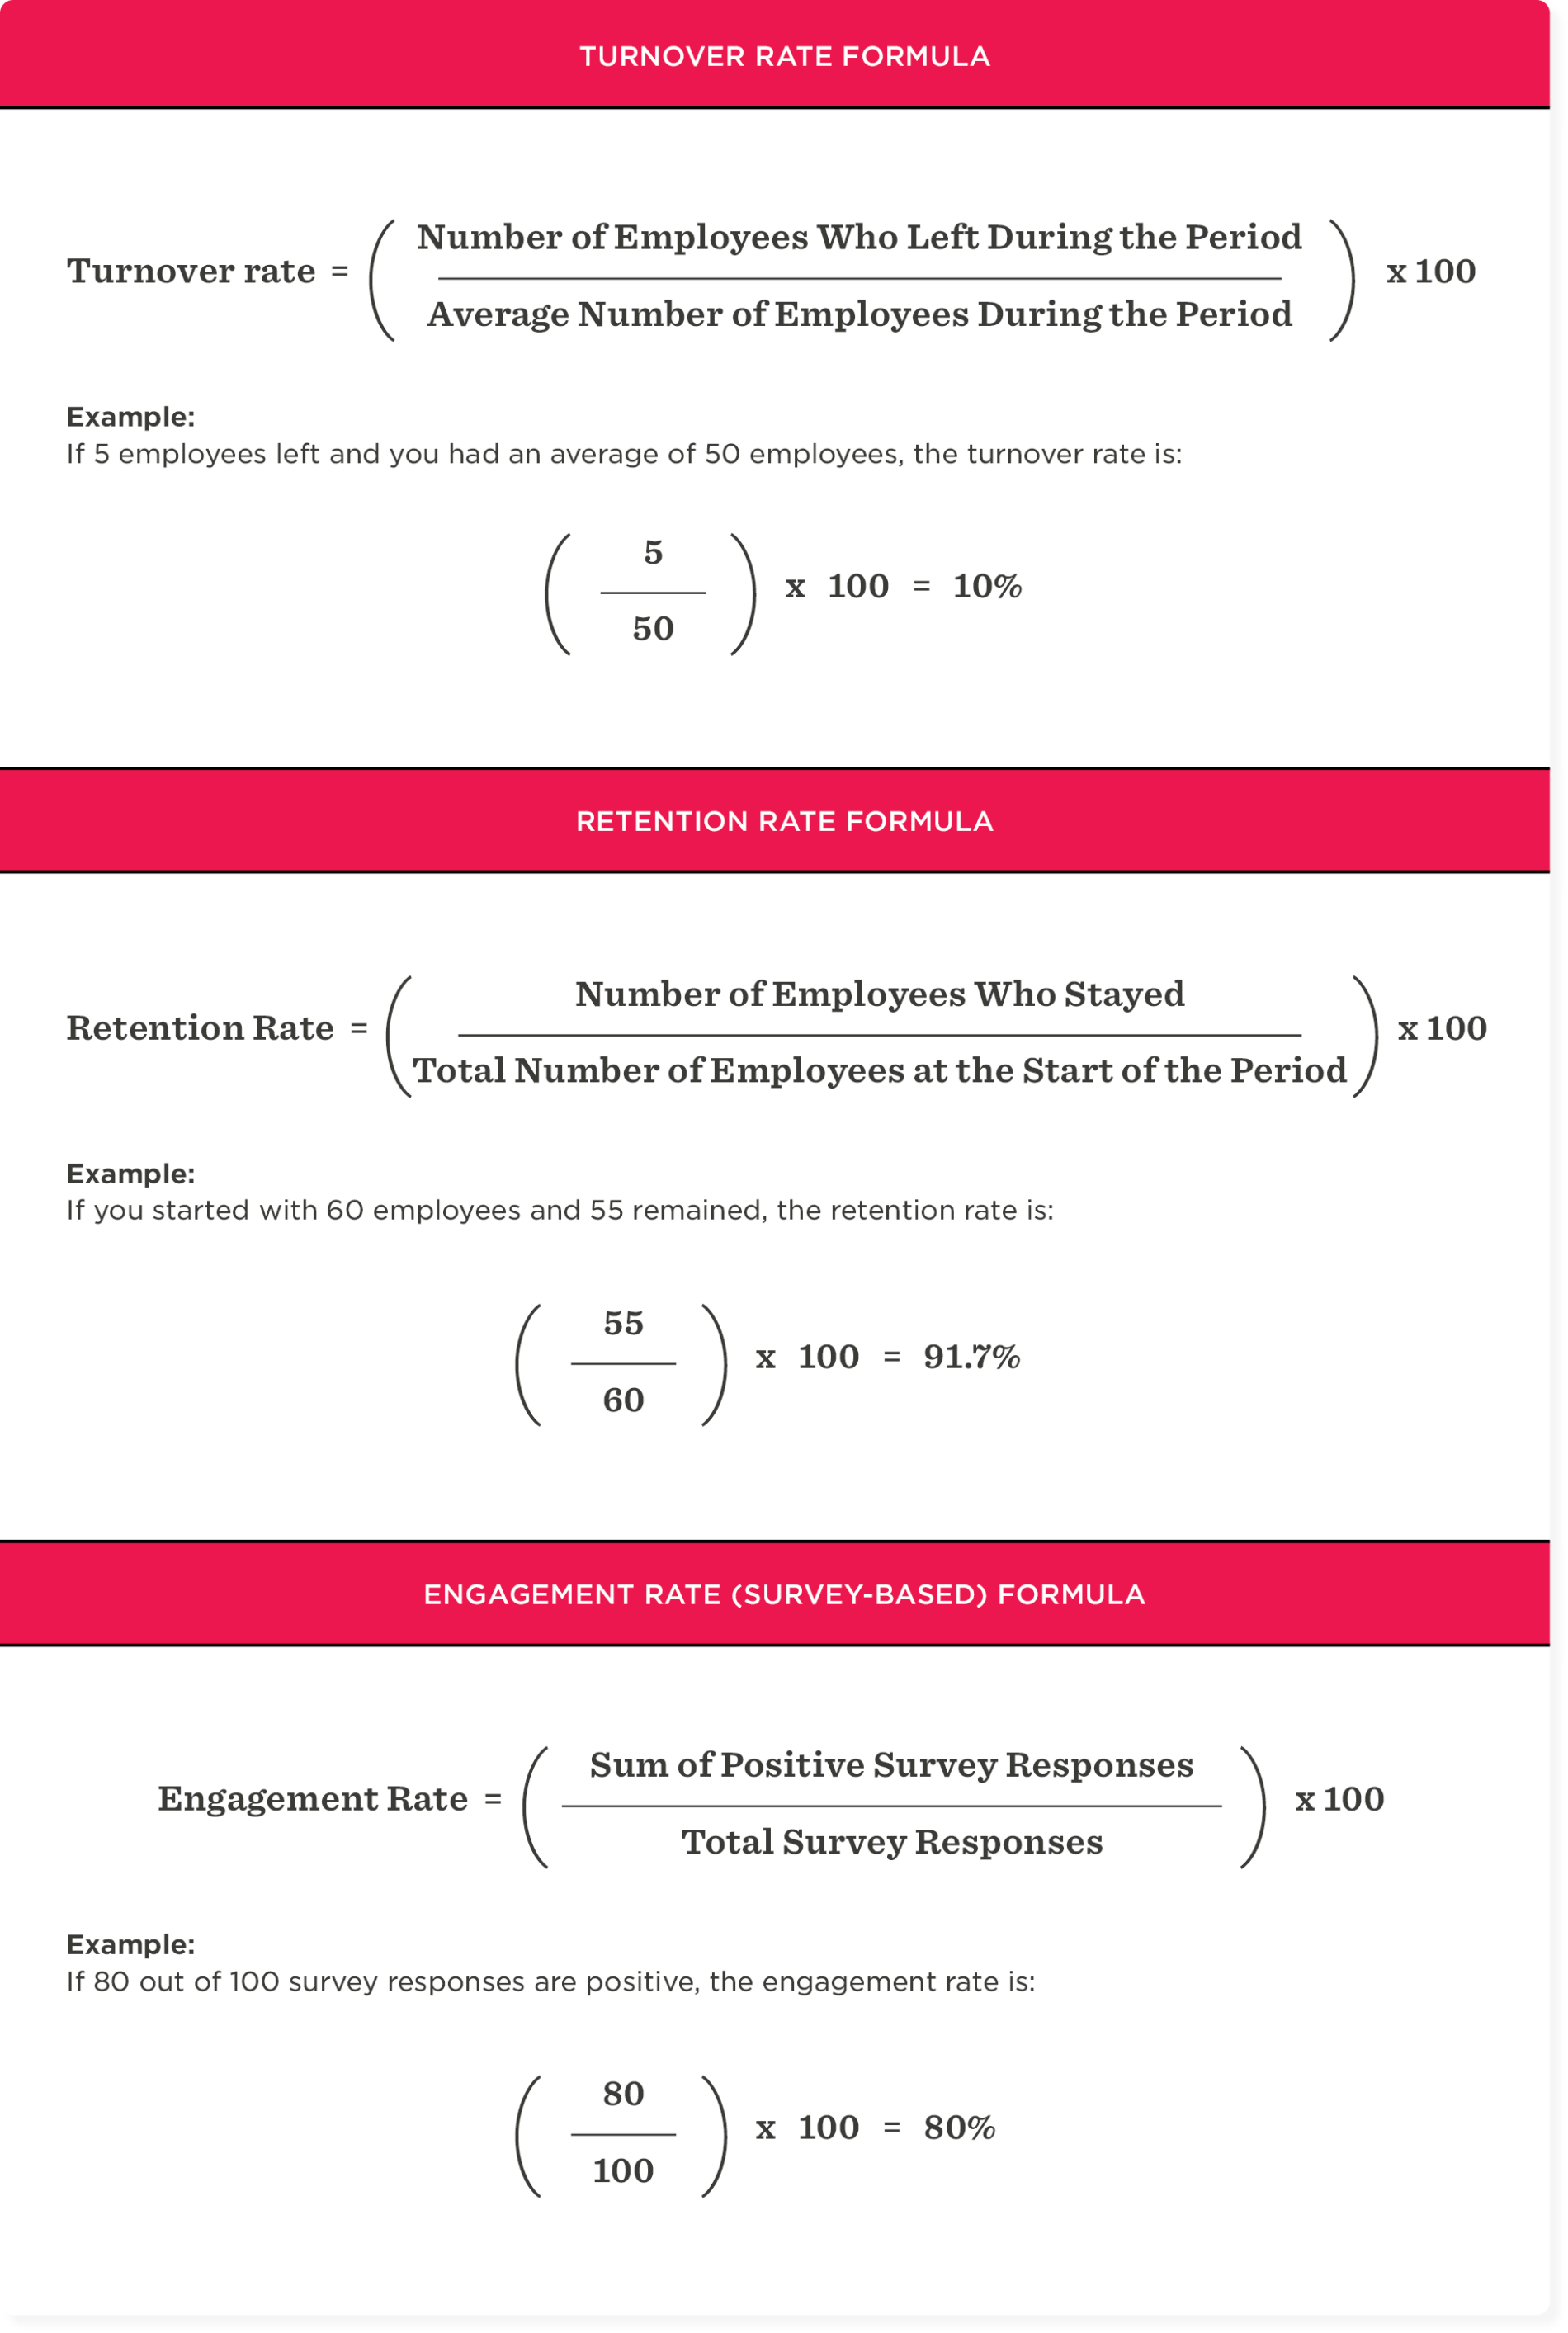
Now that we know what business language to use, let’s start quantifying your HR metrics. If you don’t have an HCM or HR tech solution to automate these calculations, these straightforward formulas can help you track key HR metrics and measure their business impact.
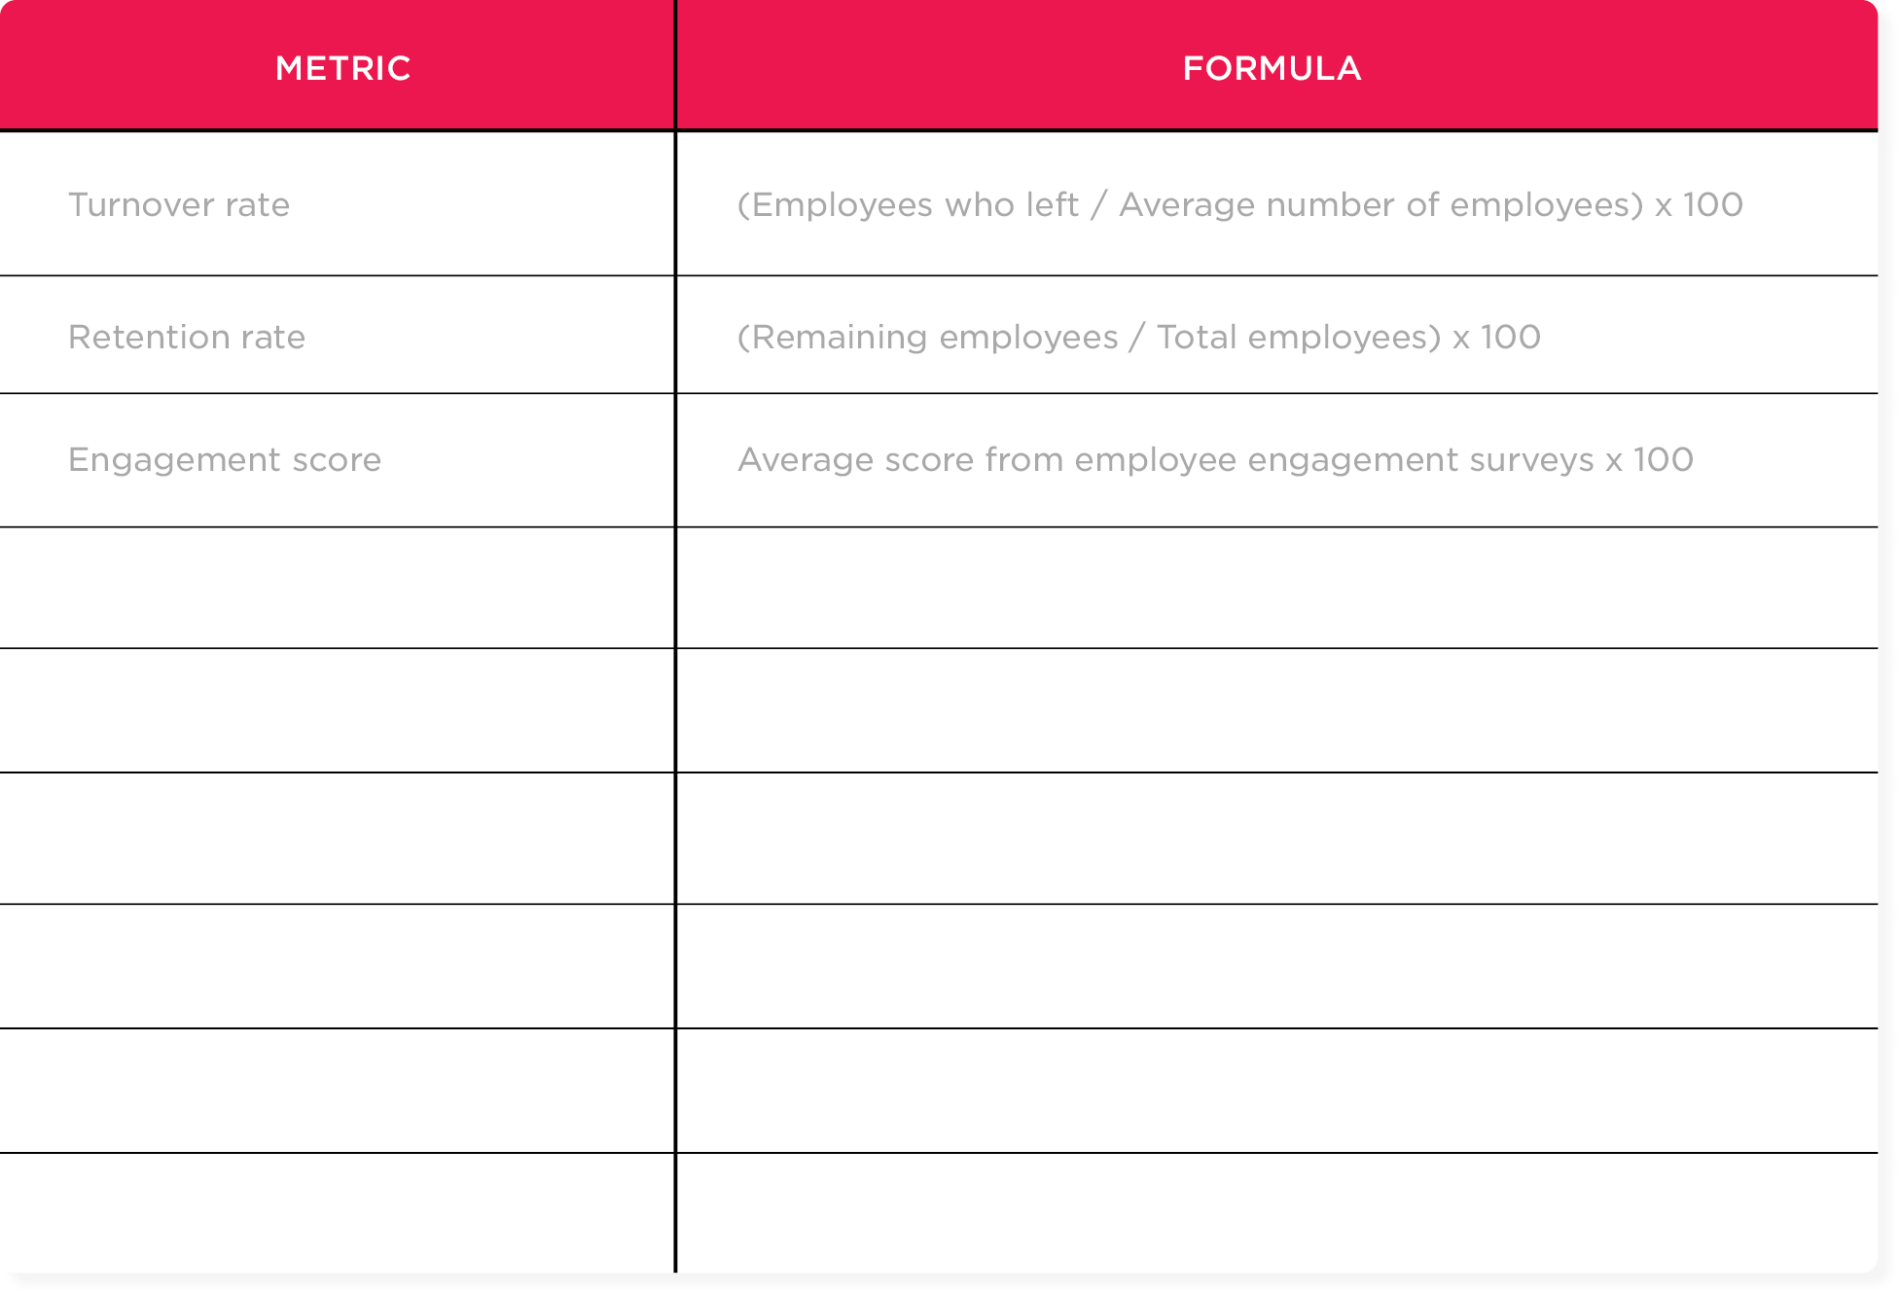
Activity: Calculate key HR metrics with the formulas above
Step one: Define your HR metrics with calculations to quantify their business impact.
Activity: Connect ROI to financial numbers
HR teams often express ROI as a percentage, but business leaders think in dollars. A 10 percent turnover rate comes with a hefty price tag, and when converted into dollars, it’s the kind of number that gets leadership’s attention. Framing HR metrics in financial terms makes their impact clear and tangible, reinforcing the value of strong retention strategies for HR and the business. Remember you don’t need to calculate things to the last penny, conservative ballpark figures are usually enough to show that the gain vastly exceeds the costs.
Start with the standard calculation for percentages. For the employee turnover rate, the formula looks like this:
Turnover rate = 5/50 x 100 = 0.1 x 100 = 10%
Instead of simply reporting a 10 percent turnover rate, translate this number into real financial impact.
A 10 percent turnover rate means that:
- In a medium-sized company with 250 employees, 25 employees are leaving.
- Cost per replacement: $40,000
- Total cost impact: 25 × $40,000 = $1,000,000
- New turnover rate: 5% → 12.5 employees leaving (approximately 12–13 employees)
- Employees retained: 25 – 12.5 = 12.5 employees saved (approx.)
- Cost per replacement: $40,000
- Total savings: 12.5 × $40,000 = $500,000
The same applies to other HR initiatives.
*The SHRM benchmark link.
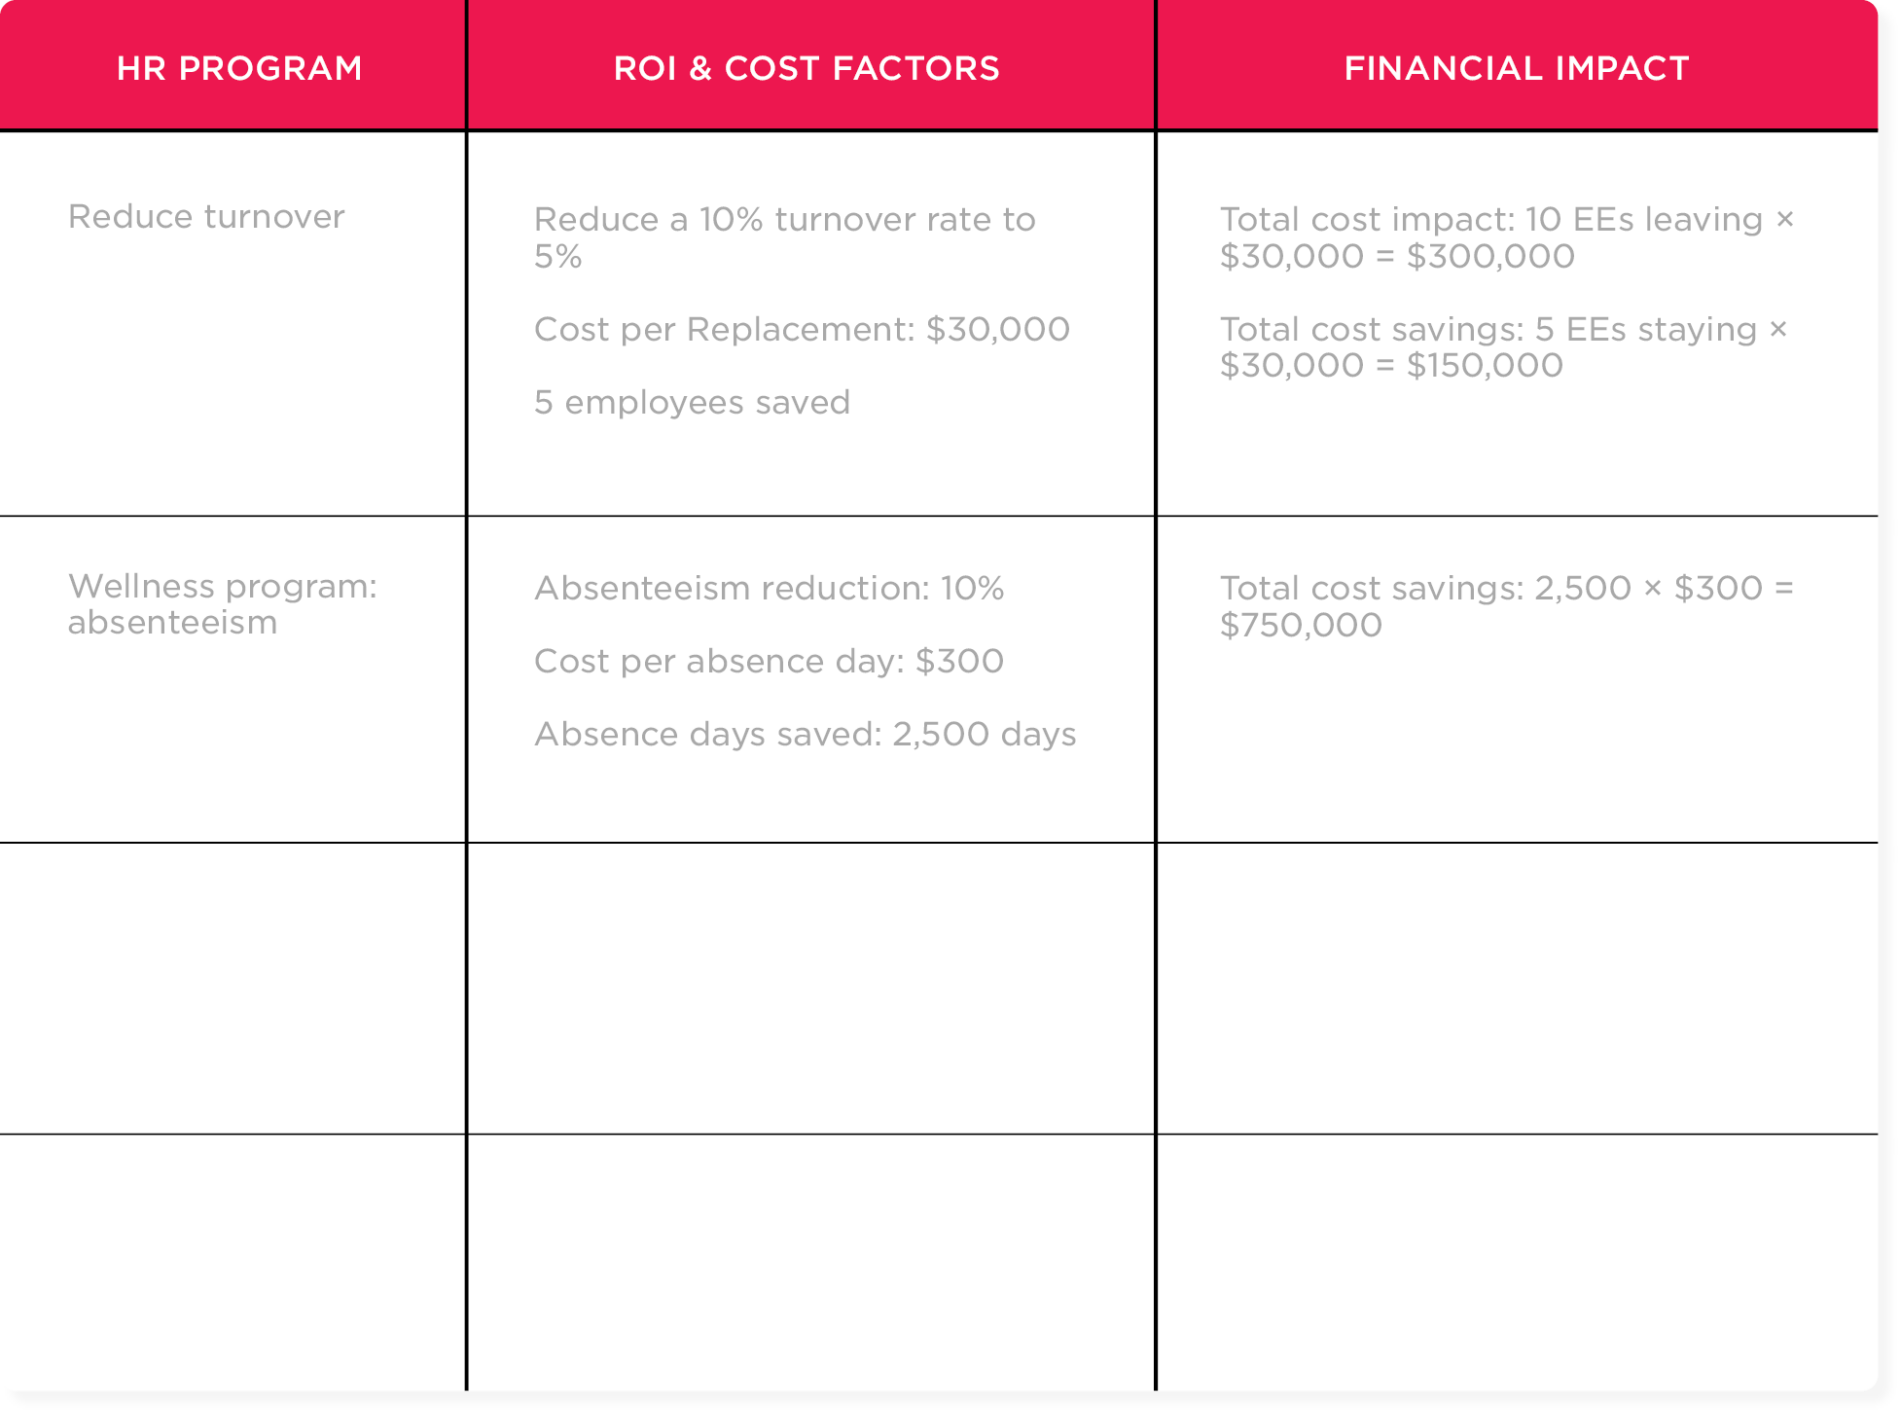
Step one: Calculate your cost savings and financial impact
Use the table below to analyze recent HR initiatives and calculate their financial impact.
Driving meaningful change
So far, you’ve aligned HR programs with business goals, tracked key metrics, and ensured your efforts resonate with business leaders. It’s time to communicate that impact in a way that speaks leadership’s language.
Storytelling transforms HR metrics into real-world impact that leadership can relate to and act on. While HR leaders naturally understand the human side of these initiatives, leadership teams need to see the business case.
To secure buy-in, frame your insights in business terms while keeping the people behind the data front and center. Storytelling connects numbers to tangible outcomes, making it easier for decision-makers to see HR’s value.
<<Download the workbook in document format to start your alignment strategy.>>
Activity: Using metrics to tell a story
Data is powerful, but storytelling makes it memorable. Here’s how to humanize your HR metrics and make them resonate with leadership.
Instead of just reporting a 20 percent increase in engagement scores, explain what caused it.
- Did new learning opportunities boost engagement? Include employee testimonials on how they benefited.
- Did career development programs increase retention? Show real examples of employees who grew within the company.
Instead of presenting data on productivity, costs, and business outcomes, connect the dots to show how HR’s work moves the needle.
- When employees feel valued, productivity increases
- When wellbeing programs reduce burnout, absenteeism decreases
- When career growth is supported, retention improves
Instead of just presenting numbers, guide leadership toward the next step.
- What’s the next step? Should the company expand its L&D programs, invest more in wellness, or improve DE&I initiatives?
- What’s the takeaway? Summarize and clearly show how HR supports business goals and where leadership should focus next.
Recommended For Further Reading
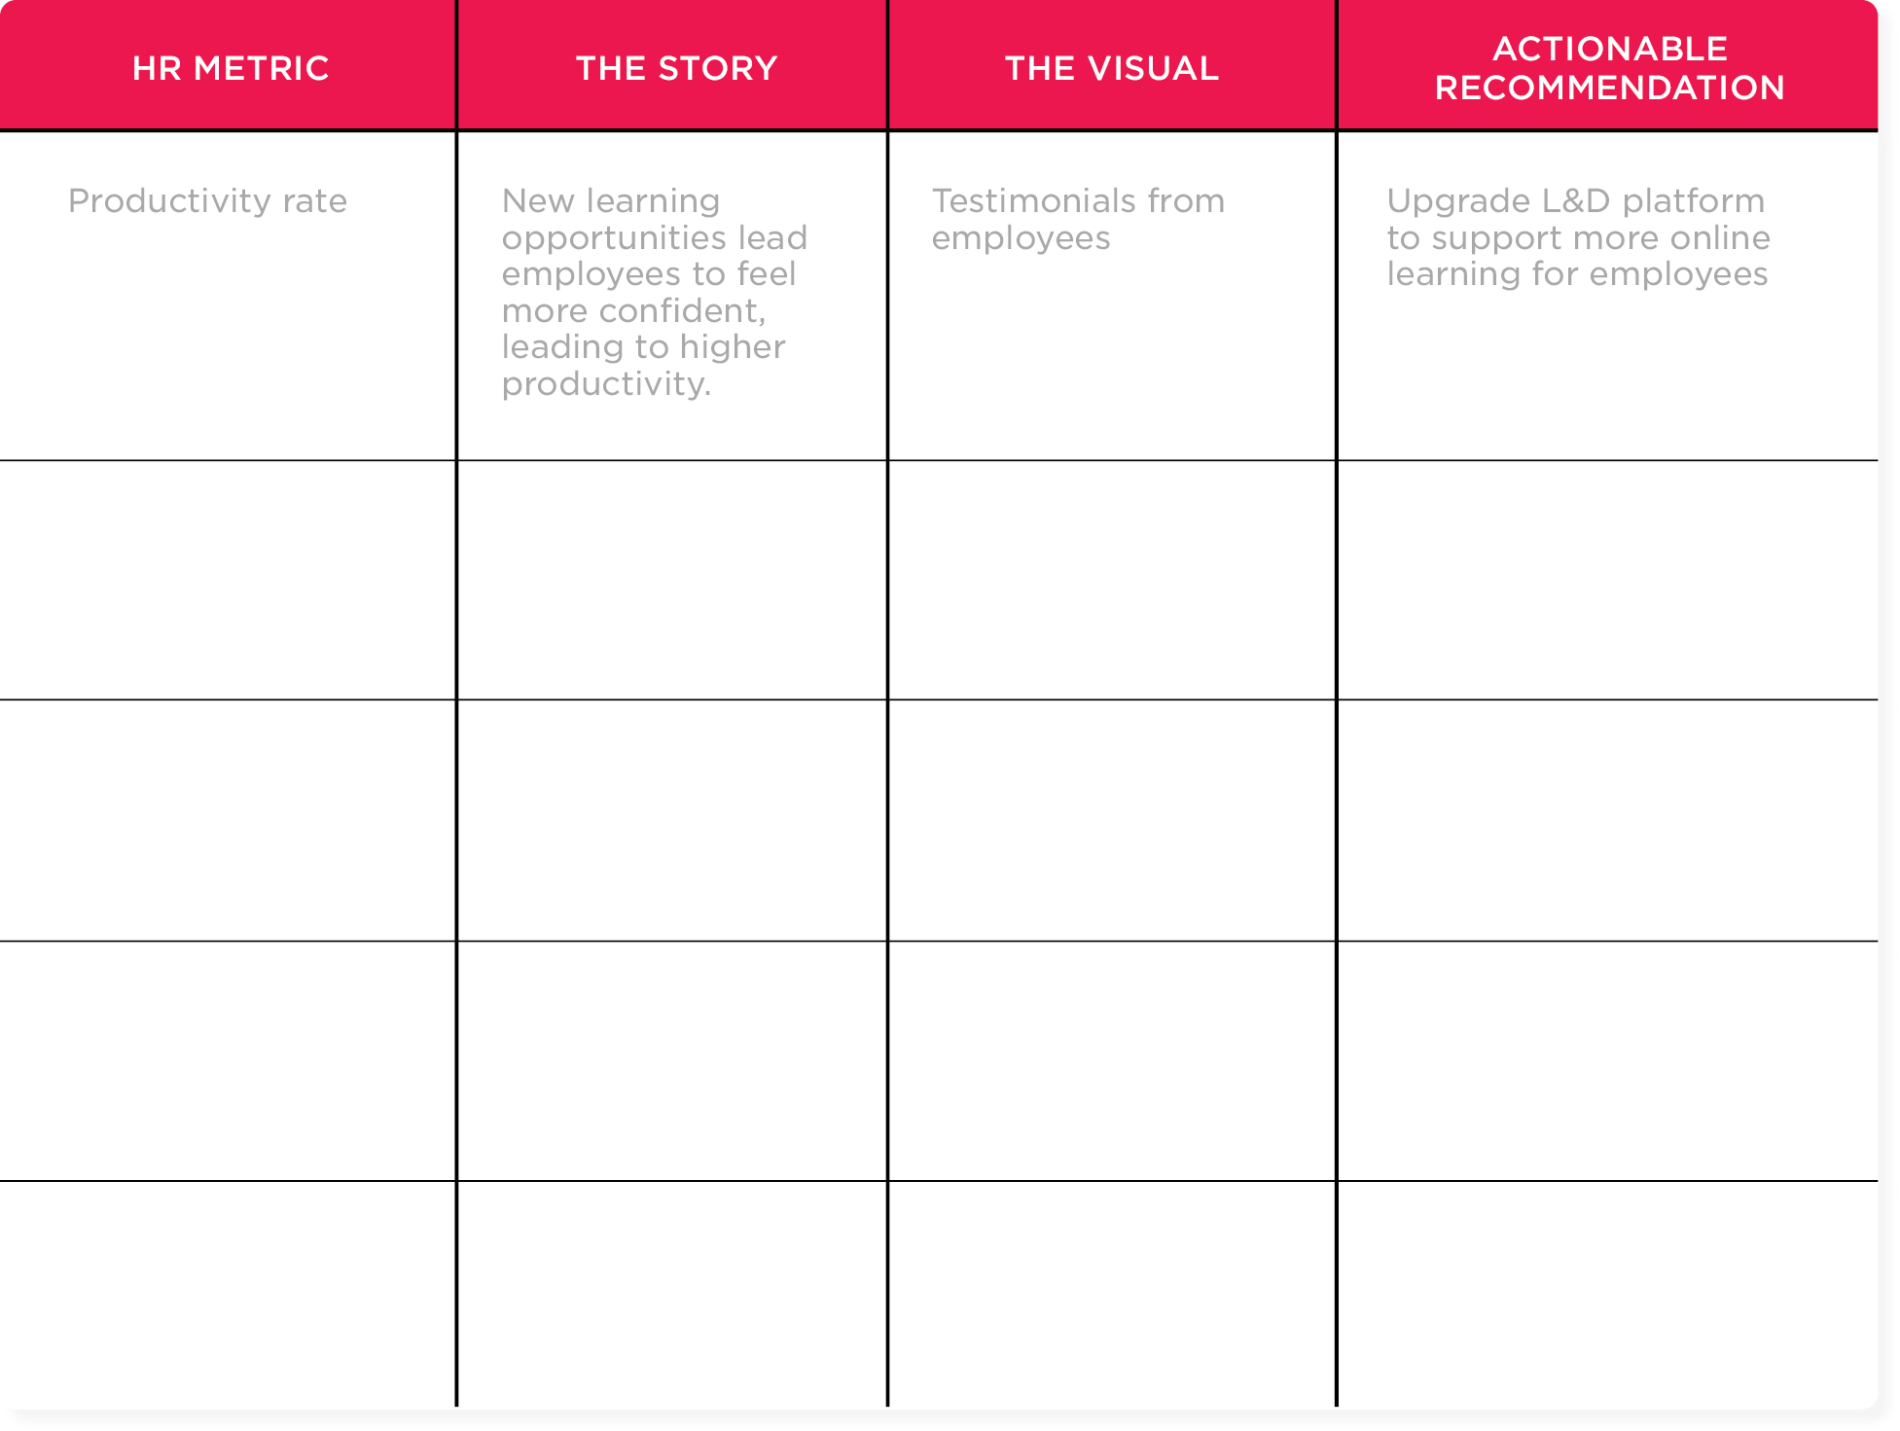
Step one: Create your own stories
Use the table below to craft compelling stories from your HR data. Start with a key metric, describe what changed, and explain how leadership can act on it.
Final thoughts: Doubling down on HR’s impact
Demonstrating the ROI of HR initiatives in business terms strengthens both employee wellbeing and business performance. It’s still about engagement, retention, and wellbeing. Just tie in revenue, productivity, and growth, and you double the impact.
Find the metrics that matter most to your business, connect them to the outcomes leadership cares about, and tell the story in a language they understand. Voila! The same HR strategy, with results that drive the business forward.